16.2. Application View
The applications on the left are the host and the applications listed on the right are the receivers. To visualize network traffic in application view of flow visualization in Motadata, specify the following:
Flow Type: Choose the flow technology from given options:
Net flow v5
Net flow v9
sFlow
Source IP: If you leave it blank then it will display all the sources IPs.
Destination IP: If you leave it blank than it will display all the destination IPs.
Time Span: Choose the time span from the drop down menu:
Last 15 minutes
Last 30 minutes
Last hour
This hour
Last 6 hours
Last 12 hours
Last 24 hours
Previous day
Today
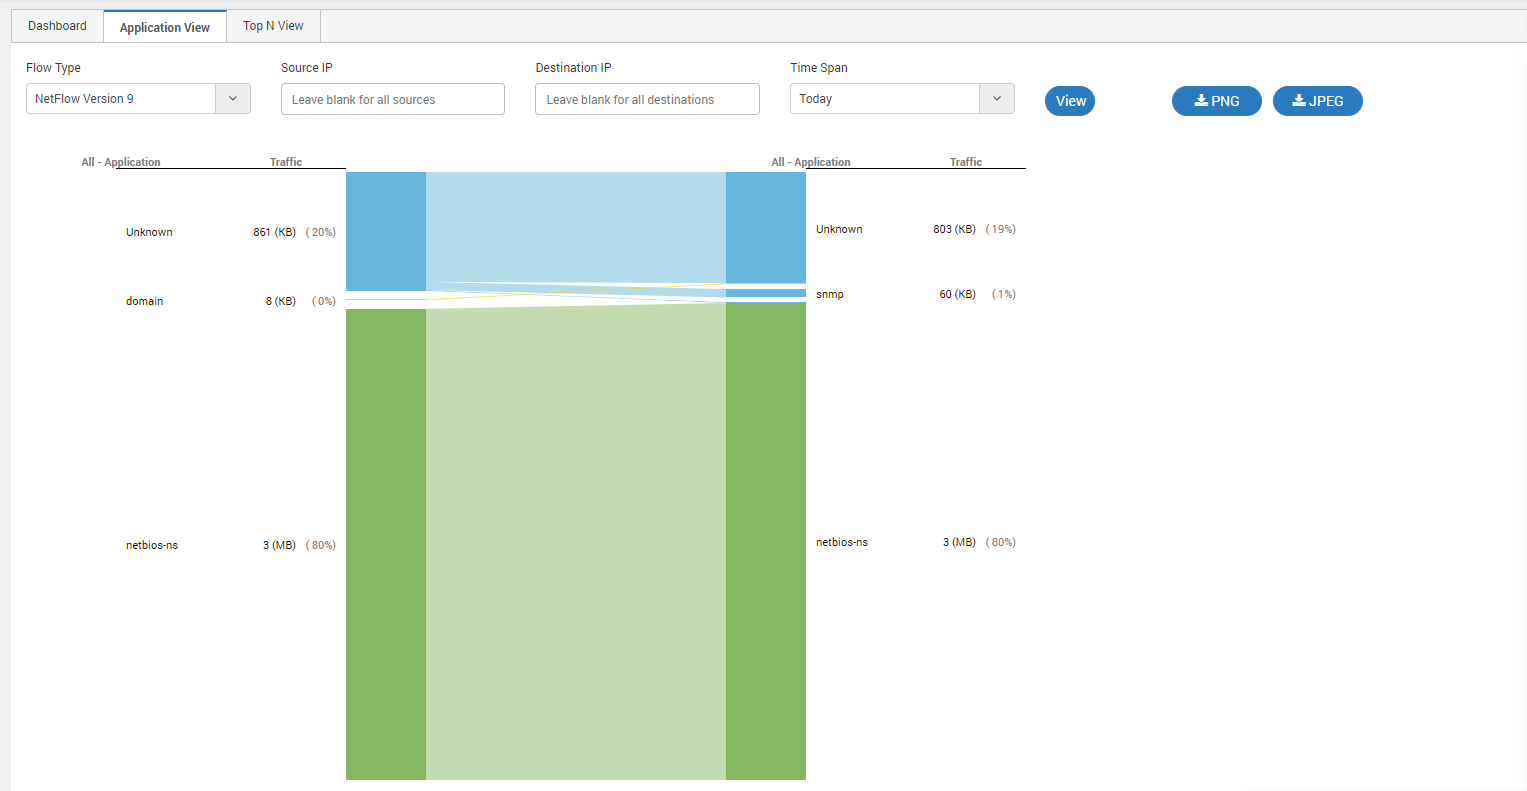
Sample Flow Visualization
If you click on any of the source application or the destination application, you will see raw level communication between host and receiver. You can export the data for every segment in PNG, JPEG or CSV format.
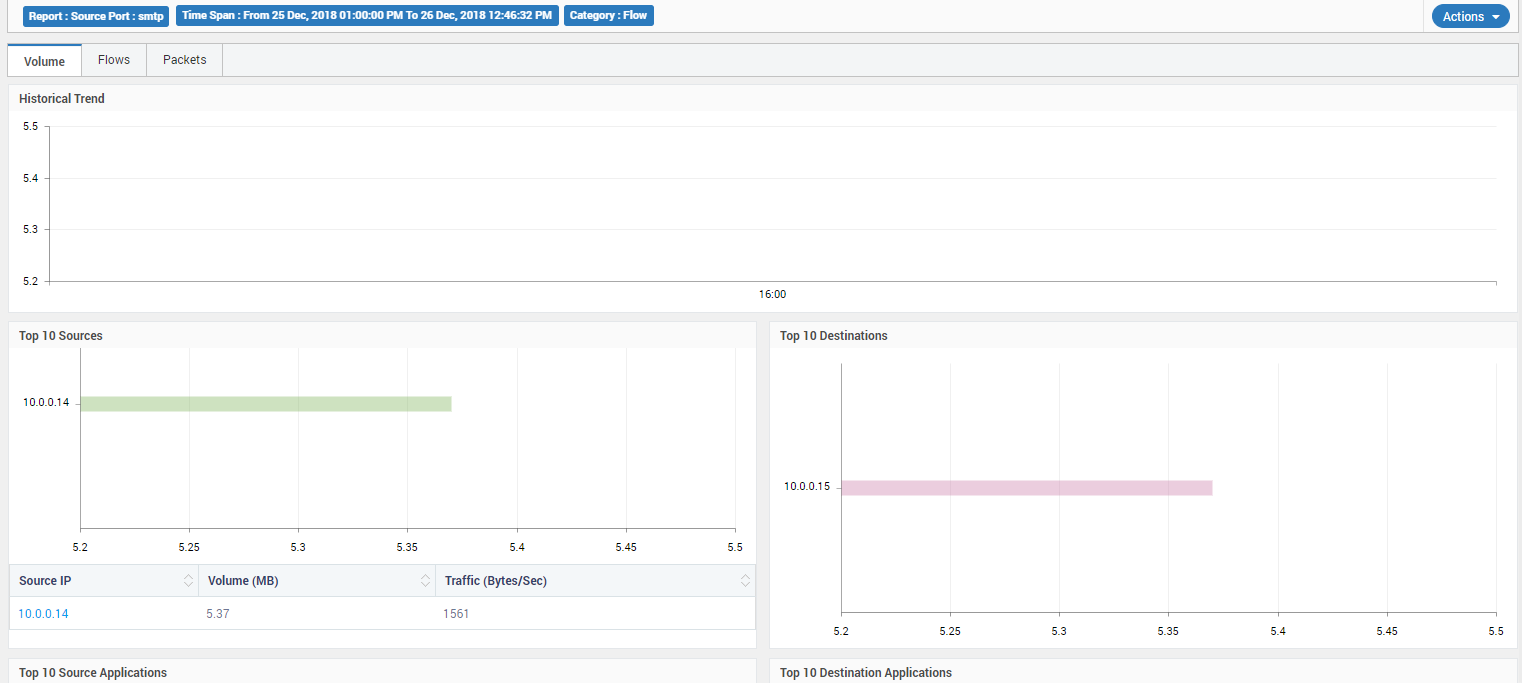
Detailed Communication between Host and Receiver
16.2.1. Volume
This tab covers the information related to the volume of flow data that occupies network traffic.
16.2.2. Flow
This tab covers all the information related to number of flows in the network traffic.
16.2.3. Packets
The tab covers all the information related to the number of packets sent in network traffic.
16.2.4. Widget Details
All 3 tabs of Application View has 10 widgets. The widgets gives you information about top resources and flows based on the parameter (the parameter is the tab heading). See the example of ‘Flow’ widgets. Similar are the widgets for ‘Volume’ and ‘Packet’.
Historical Trend: See the historical trend of network traffic processed in Motadata.
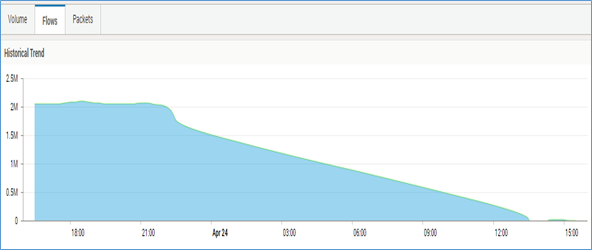
Historical Trend Graph
Top 10 Sources: This widget shows top 10 sources which have maximum number of flows in the complete network. The drill down feature also displays the IP address along with respective number of flows.
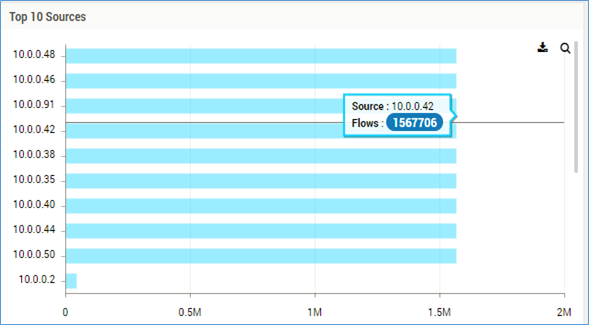
Top 10 Sources
Top 10 Destinations: This widget shows top 10 destinations which have maximum number of flows in the complete network. The drill down feature also displays the IP address along with respective number of flows.
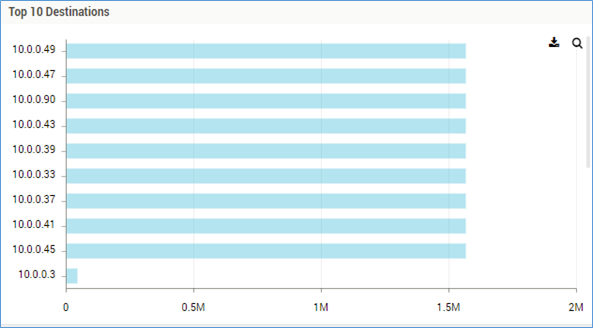
Top 10 Destinations
Top 10 Source Applications: This widget shows top 10 source applications which generate maximum number of flows in the complete network. The drill down feature also displays the IP address along with respective number of flows.
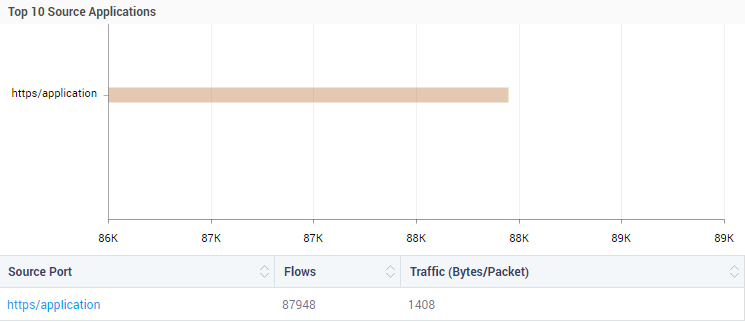
Top 10 Source Applications
Top 10 Destination Applications: This widget shows top 10 destination applications which generate maximum number of flows in the complete network. The drill down feature also displays the IP address along with respective number of flows.
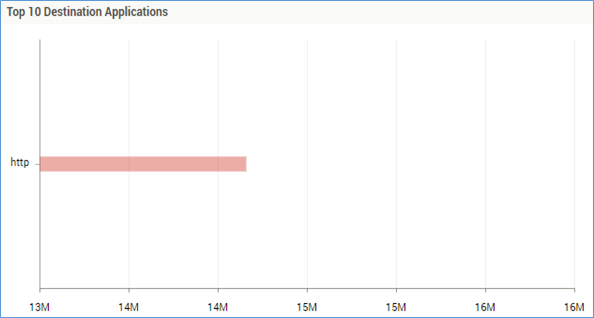
Top 10 Destination Applications
Protocol Summary: This shows the protocol summary along with the total number of flows associated with the protocol.
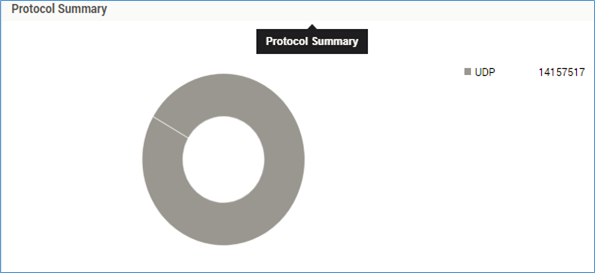
Protocol Summary
Top 10 Source Host: This widget shows top 10 source hosts which receive maximum number of flows in the complete network. The drill down feature also displays the IP address along with respective number of flows.
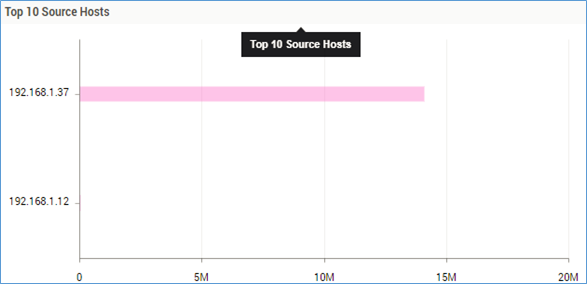
Top 10 Source Host
Top 10 Conversations: This widget shows the top 10 conversations occupying most of the traffic over the network showing source host IP along with receivers IP and the number of flows occupied by the same.
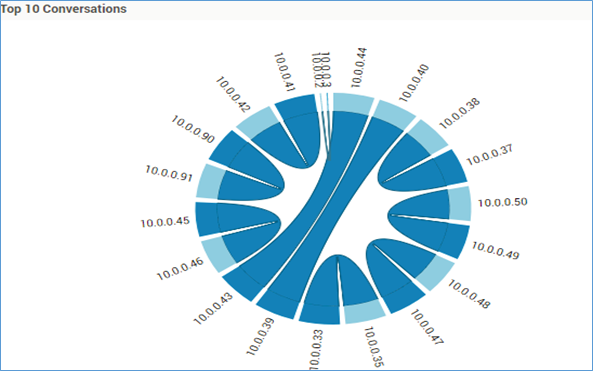
Top 10 Conversations
Top 10 Applications: This widget shows the top 10 applications occupying most of the traffic over the network showing source host application along with receiver’s application and the number of flows occupied by the same.
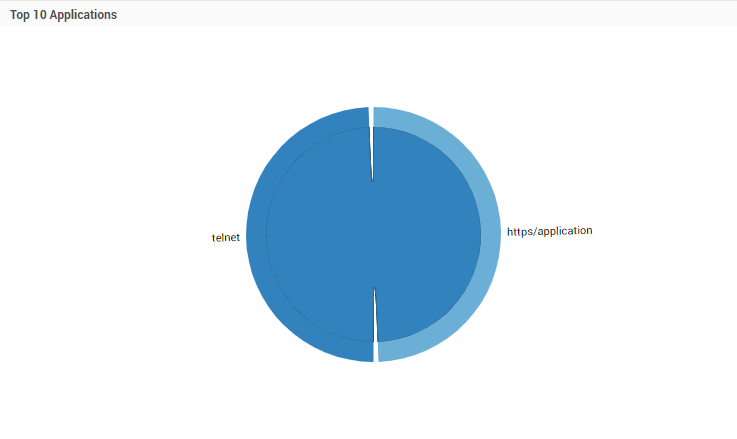
Top 10 Applications
10. Recent Flows: This shows the statistics of recent flows in a tabular format which covers the following: * Source Host * Source IP * Destination IP * Protocol Number
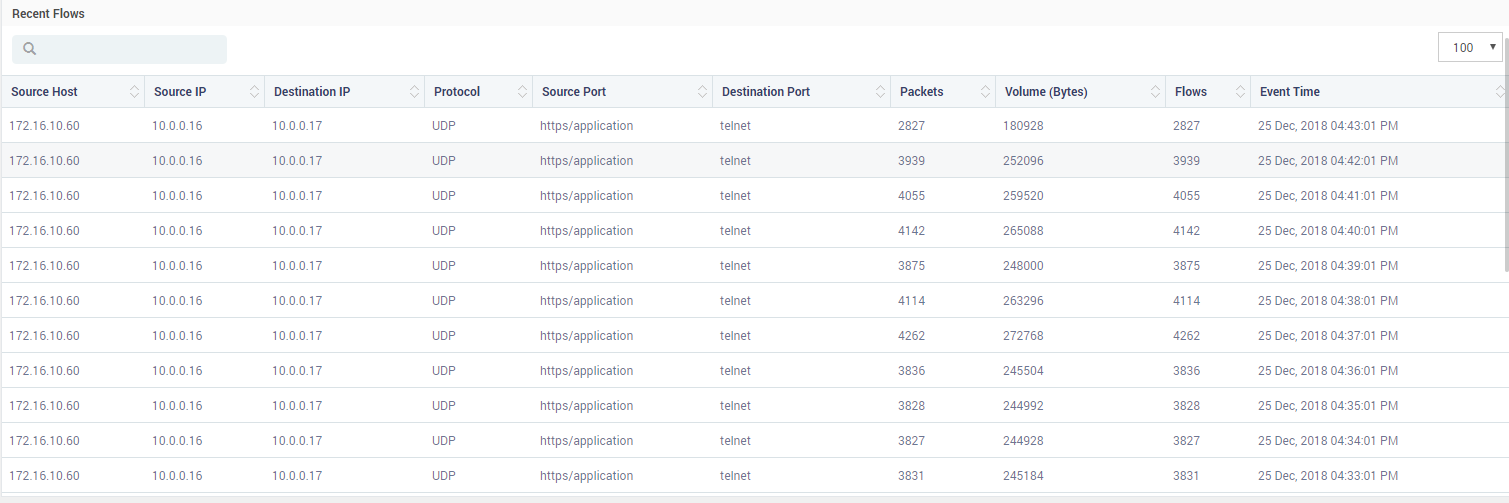
Recent Flows
16.2.5. Actions
There are 4 actions in application view of flow visualization: (Actions button on top right corner).
Export Excel: To export the data in respective tab in excel you may click on “Export Excel”. This will automatically download the excel file.
Export PDF: To export the data in respective tab in PDF format, you may click on “Export PDF”. This will automatically download the PDF file.
Time Span: You may configure time span to obtain meaningful results in the flow visualization. You may choose the required time span from the following options from the drop down:
Last 15 minutes
Last 30 minutes
Last hour
This hour
Last 6 hours
Last 12 hours
Last 24 hours
Previous day
Today
Last Week
Refresh: Click on the refresh to generate fresh set of charts and graphs.